The object of chromatography is to separate a sample into a
series of chromatographic peaks, within a reasonable time, each representing a
single component of the sample. The resolution (R) between two peaks (Fig. 1)
is given by equation 1:
R = (tR2 – tR1)
/ [(w2 + w1)/2] =
2 Δt / (w2 + w1) (1)
Where, tR2 και tR1 are the retention times of the retained components 1 και 2 measured from injection to peak maximum and w2
and w1 are peak widths in units of time measured at the base of the
peaks 1 and 2.
For two peaks that
are close w2 = w1 and equation (1) gives:
R = Δt / w1 (2)
Resolution depends upon two factors:
Narrowness of the peaks (zone width)
The distance between the peak maxima (zone separation)
Equations 1 and 2 show that as Δt increases the
resolution R between the two peaks improves. We can increase Δt by enhancing the interaction of the solutes
with the column or by increasing the column’s selectivity for one of the
solutes.
The resolution R also improves as w the peak widths become narrower.
Peak width is a kinetic effect and has to do with the partitioning of the
solute between the mobile (carrier liquid) and stationary phase (column). The
column efficiency determines the peak width
(zone spreading).
In general, the value obtained for the resolution R of two peaks
gives us a measure of the separation’s success. As R increases the separation
between the 2 compounds also improves.
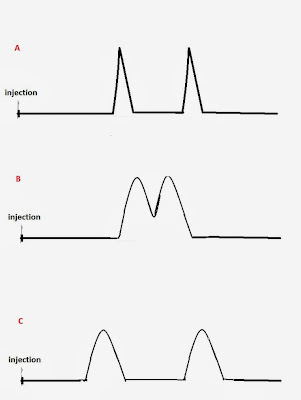
Poor resolution results when components elute close to the
unretained component. The relationship between resolution, efficiency and
selectivity are shown in Fig. 2
 |
|
Fig 2: A) Good
resolution due to column efficiency B)
Poor resolution. The compounds elute almost at the same time C) Good resolution due to column selectivity
|
Column
efficiency is expressed quantitatively by the
number of theoretical plates , N (Fig. 3).
N = (tR / σ)2 =
16 (tR / w)2 (3)
Where σ is the peak standard deviation, tR is the retention time
of the peak and w = 4σ
 |
|
Fig 3: Column
efficiency is expressed quantitatively by the number of theoretical plates N.
The column efficiency determines the peak width (zone spreading).
|
In reality, what happens when the solute is injected into the column
can be described as follows: In the beginning it occupies a narrow band of
finite width. As it travels in the column the width of its band continually increases in a process
called band broadening. Therefore,
column efficiency is concerned with the broadening of an initially compact band
of a solute as it passes through the column. The broadening is a result of the
following:
- Column design
- Column operating conditions
Basically, equation (3) (the number of theoretical plates N) compares the width of the peak w to the
length of time tR the solute (analyte) has been in the column. Thus,
an efficient column keeps bands from spreading (keeps narrow peaks).
The number of plates is proportional to the column length. The
height equivalent to a theoretical plate H is the most informative measure of
column efficiency because it allows comparison between columns of different
lengths. It is related to the number of theoretical plates N as follows:
H = L/N (4)
where L is the length of the column usually expressed in millimeters
(mm).
High performance columns have plate heights 0,3 or less.
References
1) D. Harvey, “Modern Analytical
Chemistry”, McGraw-Hill Companies Inc., 2000
2) L.R. Snyder, J.J. Kirkland, “Introduction to Modern Liquid
Chromatography”, 2nd Edition, John Wiley & Sons, 1979
3) Nina Hadden et al., “Basic Liquid
Chromatography”, Varian Aerograph, 1971
4) C. F. Simpson, “Techniques in Liquid
Chromatography” Wiley-Hayden: Chichester, England, 1982

No comments:
Post a Comment