Chemistry Net: Physical & Theoretical Chemistry - Thermochemistry
Showing posts with label Physical & Theoretical Chemistry - Thermochemistry. Show all posts

Physical & Theoretical Chemistry - Thermochemistry

Thermochemistry

THERMOCHEMISTRY


Thermochemistry is the branch of chemistry concerned with the heat effects that accompany chemical reactions - heat produced by or required for a chemical reaction. In thermochemistry, chemical reactions are divided into two categories:

  • Exothermic (Qreaction < 0) - heat is produced by the reacting system
  • Endothermic (Qreaction > 0) - heat is absorbed by the reacting system

Thermochemistry deals with determining quantities of heat produced or absorbed by a reaction both by measurement and by calculation. It rests on Lavoisier and Laplace's law and on Hess's law:

Lavoisier and Laplace's law: The energy change accompanying any reaction is equal and opposite to energy change accompanying the reverse process

Hess' law: The energy change accompanying any reaction is the same whether the process occurs in one or in several steps

These statements preceded the first law of thermodynamics (1845) and helped in its formulation.


References

  1. P. Atkins, J de Paula,  “Physical Chemistry: Thermodynamics, Structure and Change”, 10th Edition, W. H. Freeman, 2014
  2. D. A. McQuarrie, J. D. Simon,“Physical Chemistry: A Molecular Approach”, 1st Edition, University Science Books, 1997
  3. K. J. Laidler, J.H. Meiser, B.C. Sanctuary, “Physical Chemistry”, 4th Edition, Brooks Cole, 2002

Entropy changes ΔS and Thermodynamic Equilibrium – Solved Examples

Solved Examples - Entropy changes and thermodynamic equilibrium

Entropy Changes ΔS and Thermodynamic Equilibrium – Solved Examples


In a previous post entitled “Entropy, Free Energy and Thermodynamic Equilibrium” the Boltzmann definition of entropy was given and how entropy changes ΔS are associated with chemical processes was discussed. Below, some examples are given regarding entropy changes ΔS and chemical reactions.

Example #1

Choose the reaction expected to have the greatest increase in entropy:

a)  N2(g) + O2(g) ———› 2 NO(g)

b)  H2O (l)    ———›   H2O (g)

c)  2 XeO3(s)  ———›   2 Xe(g) + 3 O2(g)

d) C(s) + O2(g)   ———›  CO2 (g)


Answer:

The reaction with the greatest increase in the moles of gas will have the greatest increase in entropy. Answer (c) is correct. In general, when a reaction involves gaseous molecules and the number of gaseous products (or moles of gaseous products) is greater than the number of molecules of gaseous reactants (or moles of gaseous reactants) the entropy change ΔS increases (ΔS > 0).

More gaseous molecules means more possible configurations and therefore a greater probability to occur.


Example #2

Predict the sign of ΔS° for the oxidation of SO2 in air:

2 SO2(g)  +  O2(g)  ———›    2 SO3(g)


Answer:

Three molecules of gaseous reactants produce 2 molecules of gaseous products. The number of gaseous products is less than the number of the reactants and therefore ΔS < 0


Relevant Posts

Entropy, Free Energy and Thermodynamic Equilibrium

Phase Changes - Energy Changes - Heating Curves


References

  1. P. Atkins, J. de Paula, “Physical Chemistry”, 9th Edition, W. H. Freeman (2009)
  2. I. N. Levine, “Physical Chemistry”, 6th Edition, McGraw-Hill (2008)
  3. S. S. Zumdahl, “Chemical Principles”, 6th Edition, Houghton Mifflin Company (2009)
  4. A. W. Adamson, A. P. Gast, “Physical Chemistry of Surfaces”, John Wiley & Sons (1997

Key Terms

entropy changes examples, thermodynamic equilibrium,, ΔS, entropy increase and chemical reactions,

Entropy, Free Energy and Thermodynamic Equilibrium

Entropy, free energy and thermodynamic equilibrium

Entropy, Free Energy and Thermodynamic Equilibrium

Chemical reactions are performed by mixing the reactants and regulating external conditions such as temperature and pressure. Two basic questions though arise:

  1. Is it possible for the reaction to occur at the selected conditions?
  2. If the reaction proceeds, what determines the ratio of products and reactants at equilibrium? 

Both questions are answered by chemical thermodynamics:

  • Thermodynamics can tell us whether a proposed reaction is spontaneous (possible) under particular conditions even before the actual experiment.
  • Thermodynamics can also predict the ratio of products and reactants at equilibrium provided that the reaction is spontaneous.

Note: Thermodynamics cannot answer though how fast a reaction will proceed. The field of Chemical Kinetics studies reaction rates.

After many years of observation scientists concluded that the characteristic common to all spontaneous processes (processes that occur in a definite direction without outside intervention) is an increase in the property called entropy (S). . An example of a physical spontaneous process is shown below in Fig. I.1. A ball rolls down spontaneously a hill but never spontaneously rolls back up the hill.

Fig. I.1: A physical spontaneous process is shown. The ball rolls down the hill spontaneously. The reverse process – roll back up the hill - is not spontaneous.

An example of a chemical spontaneous process is the reaction of iron with oxygen (rusting of iron). The forward reaction is a spontaneous process (natural process that may take years to occur) but the product iron oxide in rust does not spontaneously change back to iron metal and oxygen.

4Fe(s) + 3O2 (g)   -------›  2 Fe2O3 (s)

Note: 1) Processes that are spontaneous in one direction are non-spontaneous in the reverse direction  2) The total energy in the above examples of spontaneous processes remains constant and therefore the direction of the processes cannot be attributed to energy changes. Therefore, the First law of Thermodynamics cannot explain why  spontaneous processes (natural processes) occur. As a reminder the First Law of Thermodynamics states that the energy of the universe is constant. The driving force behind spontaneous processes (natural processes) is the change in the entropy (ΔS) of the universe.

The 2nd Law of Thermodynamics states: In a spontaneous process, the entropy of the universe increases  ΔSuniverse = ΔSsys + ΔSsurr > 0


How entropy is defined?

A precise, quantitative definition of entropy was proposed by the Austrian physicist Ludwig Boltzmann in the late 19th century. According to this definition entropy is related to probability:

If a system has several states available to it, the one that can be achieved in the greatest number of ways (has the largest number of microstates) is the one most likely to occur. The state with the greatest probability has the highest entropy.

S = kB . lnΩ

Where,

kB is Boltzmann’s constant (R/NA)

Ω is the number of microstates corresponding to a given state (including both position and energy)

Note: The above definition of entropy is not useful in a practical sense for the typical types of samples used by chemists because those samples contain so many components (for example 1 mole of gas contains 6.022 x 10²³ individual particles).

Let us examine how entropy S and entropy changes (ΔS) – entropy changes can be thought as disorder – can explain the occurrence of spontaneous processes. As an example let us consider four “tagged” gas molecules (labelled 1, 2, 3 and 4) which are concentrated on the left part of the container under vacuum (Fig. I.2). The stopcock is opened and the gas molecules are allowed to equilibrate without any intervesion. If enough times elapses half of the molecules will be in each container.

In the process described above and shown in Fig. I.2 the following are observed:

  • There is no any energy change (the total energy remains constant)
  • The degree of disorder (entropy) increases after the stopcock is removed and the molecules are uniformly distributed  

How can be explained that in such a spontaneous process – a process where entropy increase is observed - the molecules tend to get uniformly distributed in the two containers?

Molecular statistics answers this question by considering the probabilities of the possible arrangements of the molecules in the two containers. Each of these arrangements defines a macrostate. There are five possible arrangements (macrostates) of the four molecules in the two containers are:

  • All 4 molecules in the left container
  • Three molecules in the left container and 1 in the right
  • Two molecules in the left container and two in the right container
  • Three molecules in the right container and 1 in the left
  • All 4 molecules in the right container

There is also a number of ways (configurations) called microstates that each of the above arrangements can be achieved:


Fig. I.2: The 16 possible microstates of a system of 4 molecules that may occupy either side of a container.

For example from Fig. I.2 the following are observed:

There is only one configuration that all four molecules are in the left container (1 microstate, Microstate #1).

There are four configurations that three molecules are in the left container and one molecule in the right container (4 microstates, Microstates #2 and #3 and #4 and #5).

There are six configurations that two molecules are in the left container and two in the right container (6 microstates, Microstates #6 up to #11 inclusive)

There are four configurations that three of the molecules are in the right container and one molecule in the left container (4 microstates, Microstates #12 to #15 inclusive).

There is only one configuration that all four molecules are in the right container (1 microstate, Microstate #16).

The above described arrangements (macrostates) and configurations (microstates) of the molecules are summarized in Table I.1 below.

The probability that one particular molecule is in the left container at a given time is ½. A second specific molecule may be either in the left or in the right container so the probability that both are in the left is ½ x ½ = ¼. The probability that all 4 molecules are in the left container is: ½ x ½ x ½ x ½ = 1/16

Continuing this argument for N = 6.023 * 1023 molecules the probability that all will be on the left is equal to:

½ x ½ x…. x ½ = (½)N ≈ 0  (where N = 6.023 * 1023) 

This is a very small probability almost equal to zero.

From Table I.1 it becomes apparent that:

The greater the number of microstates that correspond to a given macrostate, the greater the probability of that macrostate.

For example, the arrangement (macrostate) 2 molecules in the left container and 2 in the right has the greatest number of possible configurations (microstates) – 6 microstates - of the molecules. The probability that this macrostate occurs is the highest and equal to  6/16 = 3/8. As a matter of fact this macrostate is observed when the four molecules are allowed to move freely in the two containers.

The arrangement (macrostate) with the second highest probability to occur is 3 molecules in the left and 1 molecule in the right container or  3 molecules in the right and 1 molecule in the left container. The number of the possible configurations of the molecules is 4 in this case and the corresponding probability 4/16 = ¼.

Therefore, a gas placed in one end of a container will spontaneously expand to fill the entire container evenly because for a large number of gas molecules there is a huge number of microstates corresponding to equal number of molecules in both ends.

The consequences of this principle are dramatic for large number of molecules in chemical systems (as shown above) because of the following:

  • There is a huge number of particles (statistical predictions are always more accurate for larger sample)
  • The change process proceeds spontaneously (no external intervention is needed)

Table I.1: Macrostates, microstates and corresponding probabilities of a system of 4 molecules that may occupy either side of a container.
Macrostate
Configurations (microstates
Probability
Microstate # (Fig. I.2)

4 molecules in the left container

1

1/16
1
3 molecules in the left and 1 molecule in the right container
4
4/16 = 1/4
2, 3, 4, 5
2 molecules in the left and 2 molecules in the right container
6
6/16 = 3/8
6, 7, 8, 9, 10, 11
3 molecules in the right and 1 molecule in the left container
4
4/16 = 1/4
12, 13, 14, 15

4 molecules in the right container

1
1/16
16


How entropy is associated with chemical processes?

Entropy changes, ΔS – not S – are associated with changes of state (from solid to liquid, liquid to gas…). Since a change of state – for example from solid to liquid – at a substance’s melting point is a reversible process, we can calculate the change in entropy for this process by using the equation:

ΔS = qrev / T = ΔΗ / Τ      (at constant temperature T and pressure P)

Where:

ΔS change in entropy that occurs during the change of state

qrev  = ΔΗ / Τ  energy required for the reversible process to occur (for example energy required to melt 1 mole of solid at the melting point, ΔΗ is the enthalpy change of fusion)

T is the temperature where the change of state occurs (melting point, boiling point)

Equation (2) is a very important relationship since it relates entropy changes (ΔS) to macroscopic properties such as heat and volume since these changes are relatively easy to measure. The definition of entropy given by equation (1) is based on probability while the one by (2) on thermodynamic properties.


Which processes are called reversible? Which processes are called irreversible?

Reversible process is a process that the system changes in such a way that the system and surroundings can be put back in their original states by exactly reversing the process.

An example of a reversible process is the heat that can be transferred between two bodies by changing the temperature difference between them in infinitesimal steps each of which can be undone by reversing the temperature difference


An irreversible process cannot be undone by reversing the change of the system. Spontaneous processes are irreversible.

An example of an irreversible process is the free expansion of a gas into a vacuum (Fig. I.2).

Solved examples on entropy changes are given in the post entitled “Entropy changes ΔS and Thermodynamic Equilibrium – Solved Examples”.


Relevant Posts

Free energy, entropy and thermodynamic equilibrium

Gas Laws - Ideal Gas Law


References

  1. P. Atkins, J. de Paula, “Physical Chemistry”, 9th Edition, W. H. Freeman (2009)
  2. I. N. Levine, “Physical Chemistry”, 6th Edition, McGraw-Hill (2008)
  3. S. S. Zumdahl, “Chemical Principles”, 6th Edition, Houghton Mifflin Company (2009)
  4. A. W. Adamson, A. P. Gast, “Physical Chemistry of Surfaces”, John Wiley & Sons (1997

Key Terms

spontaneous processes, reversible process, irreversible process, entropy, entropy changes, ,ΔS, , microstate, macrostate, Boltzman's constant, chemical thermodynamics

Free Energy, Entropy, Thermodynamic Equilibrium

Entropy, free energy and thermodynamic equilibrium

Entropy, Free Energy and Thermodynamic Equilibrium

Chemical reactions are performed by mixing the reactants and regulating external conditions such as temperature and pressure. Two basic questions though arise:

  1. Is it possible for the reaction to occur at the selected conditions?
  2. If the reaction proceeds, what determines the ratio of products and reactants at equilibrium? 

Both questions are answered by chemical thermodynamics:

  • Thermodynamics can tell us whether a proposed reaction is spontaneous (possible) under particular conditions even before the actual experiment.
  • Thermodynamics can also predict the ratio of products and reactants at equilibrium provided that the reaction is spontaneous.

Note: Thermodynamics cannot answer though how fast a reaction will proceed.


After many years of observation scientists concluded that the characteristic common to all spontaneous processes (processes that occur without outside intervention) is an increase in the property called entropy (S).


How entropy is defined?

A precise, quantitative definition of entropy was proposed by the Austrian physicist Ludwig Boltzmann in the late 19th century. According to this definition entropy is related to probability:

If a system has several states available to it, the one that can be achieved in the greatest number of ways (has the largest number of microstates) is the one most likely to occur. The state with the greatest probability has the highest entropy.

S = kB . lnΩ

Where,

kB is Boltzmann’s constant (R/NA)

Ω is the number of microstates corresponding to a given state (including both position and energy)

Note: The above definition of entropy is not useful in a practical sense for the typical types of samples used by chemists because those samples contain so many components (for example 1 mole of gas contains 6.022 x 10²³ individual particles).


How entropy is associated with chemical processes?

Entropy changes, ΔS – not S – are associated with changes of state (from solid to liquid, liquid to gas…). Since a change of state – for example from solid to liquid – at a substance’s melting point is a reversible process, we can calculate the change in entropy for this process by using the equation:

ΔS = qrev / T = ΔΗ / Τ      (at constant temperature T and pressure P)

Where:

ΔS change in entropy that occurs during the change of state

qrev  = ΔΗ / Τ  energy required for the reversible process to occur (for example energy required to melt 1 mole of solid at the melting point, ΔΗ is the enthalpy change of fusion)

T is the temperature where the change of state occurs (melting point, boiling point)

Phase Changes - Energy Changes - Heating Curves

Phase changes - energy changes - heating curves

Phase Changes - Energy Changes - Heating Curves


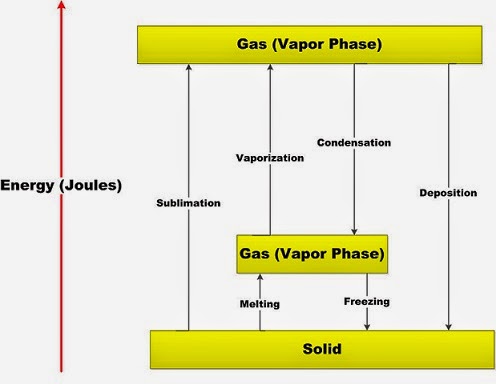
Many important properties of liquids and solids relate to the ease with which they change from one state to another. Water for example, when heated it evaporates that is changes from liquid to the gas state. In general, each state of matter (solid, liquid, gas)  can change into either of the the other two states. Figure I.1 shows these transformations which are called phase changes or changes of state.

Fig. I.1: Phase changes between the three states of matter and the corresponding energy changes.

What happens when a solid is heated? Typically, it melts to form a liquid. If the heating continues, the liquid at some point boils and forms the vapor phase (gas). This process can be represented by a heating curve: a plot of temperature versus time for a process where energy is added at a constant rate. The heating curve of water is shown in Fig. I.2.

There are five separate zones on the graph (heating curve) of Fig. I.2:


Zone 1 (Ice):

As energy flows into the ice, the random vibrations of the water molecules increase as the temperature rises from -20 °C to 0 °C. Eventually, the molecules become so energetic that they break loose from their solid lattice positions and the change from solid to liquid occurs. This is indicated by a plateau at 0 °C on the heating curve. At this temperature, called the melting point, all the added energy is used to break the ice structure by breaking the hydrogen bonds, thus increasing the potential energy of the water molecules. The enthalpy change that occurs at the melting point when a solid melts is called the heat of fusion or enthalpy of fusion ΔΗfus. The temperature remains constant until all the solid has changed to liquid.

The general equation for calculating heat energy required to change the temperature of a solid is:

Q = m * cs * ΔΤ      (1)

Where: Q heat energy (Joules)

cs specific heat of the solid (Joules/g°C)

ΔΤ temperature change (°C)


Notes:

Specific heat of a solid cs is the amount of heat energy that changes the temperature of 1.0 g of a solid by 1.0 °C.

Each substance has its own specific heat. The specific heat of ice is for example 2.1 Joules/g°C.


Zone 2 (Ice & Water):

In zone 2, the temperature remains constant at 0 °C. At this temperature, called the melting point, all the added energy is used to disrupt the ice structure by breaking the hydrogen bonds and potential energy is increasing. The attractive forces that hold particles in fixed positions in the solid must be overcome to form the liquid. The heat absorbed in this case is called the heat of fusion or enthalpy of fusion and is symbolized ΔΗfusion.

Each substance has its own heat of fusion. The heat of fusion of ice is 340 Joules/g. Exactly the same amount of heat is given up when 1.0 g of water is changed to ice. This heat is called the heat of crystallization.

The general equation for calculating heat energy to change a solid to a liquid is:

Q = m * ΔΗfusion     (2)

Where: Q heat energy (Joules, J)

m mass of solid (g)

ΔH heat or enthalpy of fusion (J/g)


Zone 3 (Water):

The temperature is again changing as soon as all the solid (ice in this case) has changed to liquid. Then it begins to increase again starting from 0 °C up to 100 °C. The particles of a liquid are in constant motion and they are not held together as tightly as the particles of a solid. To change the temperature of a liquid heat energy must be added according to equation (1) and where m is the mass of 1.0 g of water in this case, where cs is the specific heat of water (cs)water = 4.2 J/g°C and ΔΤ is the temperature change.

Fig. I.2: The heating curve of water (for a given quantity of water where energy is added at a constant rate). The plateau at the boiling point is longer than the plateau at the melting point because it takes  seven times more energy (seven times the heating time) to vaporize liquid water than to melt ice. There are five zones in the heating curve (ice, ice&water, water, water & steam, steam) each one having its own unique formula for calculating heats.


Zone 4 (Water & Steam):

At 100 °C the liquid water reaches its boiling point, and the temperature again remains constant as the added energy is used to vaporize the liquid. The heat absorbed is called heat of vaporiza-tion(ΔΗvapor). This heat is increasing the potential energy of the molecules of the liquid. Each substance has its own heat of vaporization. The heat of vaporization for water is 2270 J/g. Exactly the same amount of heat is given up when 1.0 g of water vapor is changed to liquid water. This heat is called the heat of condensation.

The general equation for calculating heat energy to change a liquid to a gas is:

Q = m * ΔΗvapor     (3)

Where: Q heat energy (Joules, J)

m mass of solid (g)

ΔHvapor heat or enthalpy of vaporization (J/g)


Notes:

Each substance has its own heat of vaporization. The heat of vaporization for water is 2270 J/g.


Zone 5 (Steam):

When all the liquid is changed to vapor the temperature again begins to rise. Note that phase changes are physical changes. No chemical bonds have been broken but intermolecular forces have been overcome. On the average, gaseous molecules are many times further apart from each other than molecules of solids and liquids.

To change the temperature of a gas, heat energy must be added. The amount of heat energy that changes the temperature of 1.0 g of a gas by 1.0 °C is called its specific heat (cs)gas. Each substance has its own specific heat. The specific heat of steam is 2.02 J/g°C.

To change the temperature of a gas heat energy must be added according to equation (1) and where m is the mass of 1.0 g of steam in this case, where cs is the specific heat of steam (cs)steam = 2.02 J/g°C and ΔΤ is the temperature change.


Note:

All substances have the same basic heating curve graphs (five zones). The differences are going to be the transition temperatures, and the values for specific heats cs and ΔΗ’s.


Relevant Posts

Free energy, entropy and thermodynamic equilibrium

Gas Laws - Ideal Gas Law


References
  1. P. Atkins, J. de Paula, “Physical Chemistry”, 9th Edition, W. H. Freeman (2009)
  2. I. N. Levine, “Physical Chemistry”, 6th Edition, McGraw-Hill (2008)
  3. S. S. Zumdahl, “Chemical Principles”, 6th Edition, Houghton Mifflin Company (2009)
  4. A. W. Adamson, A. P. Gast, “Physical Chemistry of Surfaces”, John Wiley & Sons (1997

Key Terms
phase changes, changes of state, heating curve, heat of fusion, enthalpy of fusion, ,ΔΗ, , specific heat